Topics:
Never Miss a Beat - Get Updates Direct to Your Inbox
FILTER:

A Complete Guide To Financial Trend Analysis
By Quiet Light
Do you want to buy an online business that is growing or a business that is failing? Unless you are one of those rare entrepreneurs whose acquisition strategy revolves around acquiring and turning around distressed assets, most buyers want online businesses that are growing.
Of course, it’s not always easy to know if a business is going to grow in the future, so we develop techniques and tools to help us make predictions. While some buyers are entirely comfortable breaking out advanced analytics and computations to aid their predictions, most buyers mistakenly rely on “gut feeling” and a glance at simple monthly trends.
Of course, making a significant investment based on gut feelings isn’t exactly a formula for success. While you may have good instincts for the strength of a brand, looking at data demands that you let the data ‘talk’.
Later in this post I’ll show you a business that appears to be growing, but is, in fact, rapidly slowing down.
How Most People Evaluate a Financial Trend
One of the most common (and easiest) techniques you can employ is a simple monthly trend analysis. You probably already do this instinctively: you look at the month by month revenue and earnings of a business and decide if the website is growing or in decline.
Monthly trend analysis looks at how a business performs from one month to the next. If the business is growing one month to the next, the assumption is that the business has a positive trend.
But this approach can be misleading and often gives a weak foundation for your assumptions. Monthly trends are subject to seasonality and also have a tendency to over-amplify short-term changes and adjustments. As a result, a business can appear to be growing at a glance, but in reality, it is in decline or will soon be in decline.
Because of this, I want to introduce a financial trend analysis that is slightly more useful than a month by month report. I want to discuss analyzing “year-over-year” trends.
Why Year-Over-Year Trend Analysis Beats Monthly Trend Analysis
A year-over-year trend compares a website’s performance over similar time periods. In other words, instead of comparing how well February performed compared to January, you would compare February of this year against February of last year.
There are several reasons why this approach is better:
- Year-over-year trends show and normalize seasonality. Some businesses are obviously very seasonal (for example, a website that sells Halloween costumes). But most businesses experience some levels of seasonality, just to a lower degree. E-commerce stores, for example, often see a seasonal lift in December. B2B service or SaaS businesses often see a decline during the summer when decision-makers are more likely to be on vacation. While monthly trends will show seasonality, seeing the same trends in multiple years helps identify that the fluctuations are seasonal.
- Year-over-year trends neutralize seasonality. This is one of the great advantages of this approach: some months naturally have more potential to perform well than others. Rather than compare two months whose potential is different, year-over-year trends look at months with similar potential. In a monthly analysis, you may think that February underperformed relative to January, but its possible that February lived up to its potential while January fell short of its total potential. Year over year analysis helps uncover the real potential of a month.
- Year-over-year trends are better predictors of the future. Because different months may have more potential to perform well than others, a year over year trend provides a better assumption to make future predictions. So instead of saying that the business grew 20% over the previous month (which could be a result of seasonality), you may see that the business grew on average by 20% over the last year.
Thinking of Selling Your Business?
Get a free, individually-tailored valuation and business-readiness assessment. Sell when you're ready. Not a minute before.
A year-over-year analysis gives you most of the same benefits that a month to month analysis provides, but it adds the benefit of removing the variables of the time of year.
Of course, this approach isn’t without its weaknesses, especially if you are digging deep into your analysis. You should consider the following when looking at a year over year analysis:
- Consider moveable holidays. Holidays such as Easter can fall during different months of the year. While the effect shouldn’t be too big, it can cause some impact as customers are often disengaged in commerce with vacations.
- Natural and man-made disasters. Again, look at your data historically and understand the context of the time period you are looking at. Significant news can impact a single month.
- Look for big patterns. In any analysis, working from larger sets of data and larger timeframes will give you a better sense for a real pattern. If you get ‘too close’ to the data, you can start to see anomalies and misinterpret them for trends.
How To Perform a Year-Over-Year Financial Trend Analysis
Performing a year-over-year analysis isn’t difficult using any spreadsheet software. In fact, it is a very straightforward process. Follow the steps in the presentation below if you want a quick tutorial on how to set up your spreadsheet.
I’ve also created a Google Docs template that you are free to use and download. You will want to modify this for your purposes.
Case Study: Is This a Growing Business?
Now that we know how to do a year-over-year analysis let’s take a look at a hypothetical business whose owner claims that his business is growing at a rapid and consistent rate. To prove this claim, the owner provides a graph of monthly growth:
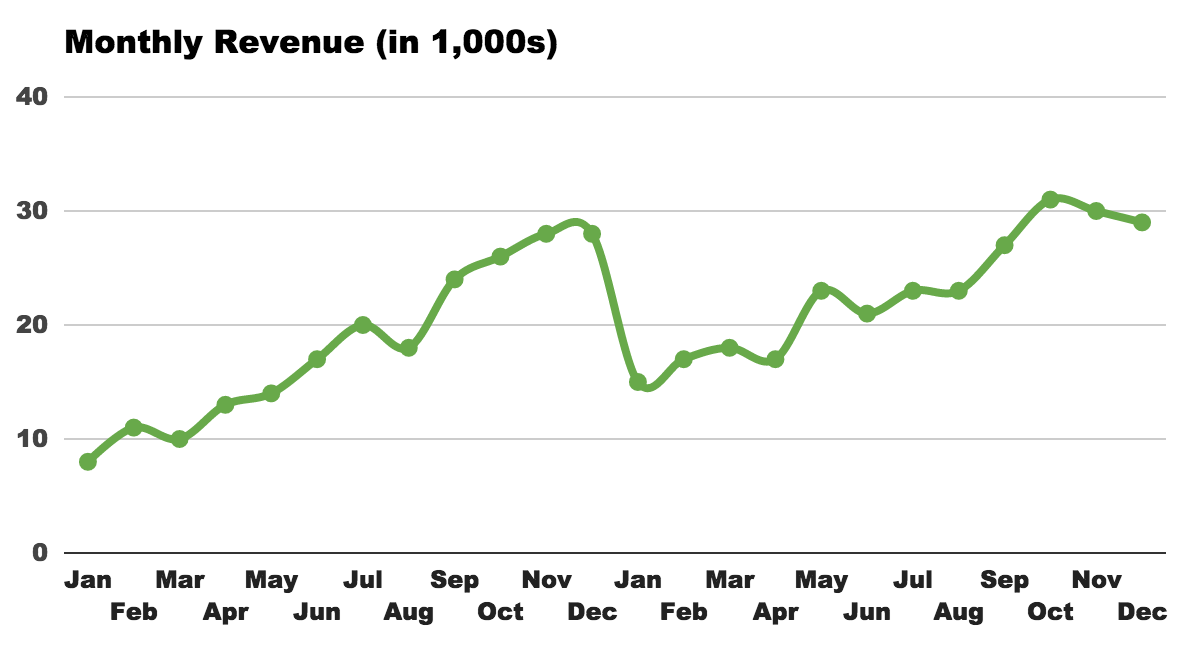
Based on the chart above, the business does appear to have positive trends along with some seasonality (especially in the 4th quarter). This seasonality will become apparent when we look at the financials year-over-year.
Here is the same data when we plot it in a year-over-year comparison:

With the revenue plotted out like this, a couple of things become much more clear.
First, this business is very seasonal. While we can see that with the month to month graph, this graph drives the point home as we see the business’s revenues rising and falling in tandem over two different years. If you had a few more years worth of data, you could confirm with more certainty that monthly volatility is more a result of seasonality rather than anything else.
Buy a Profitable Online Business
Outsmart the startup game and check out our listings. You can request a summary on any business without any further obligation.
But more important than that, while there is no denying that the business has been growing rapidly, there is some question about whether the business is growing rapidly. If you look at the distance between our two lines, you can see that the space is quickly shrinking.
If you take this one-step further and graph out the percent growth, you should see if there is a definite trend in the growth of the business.
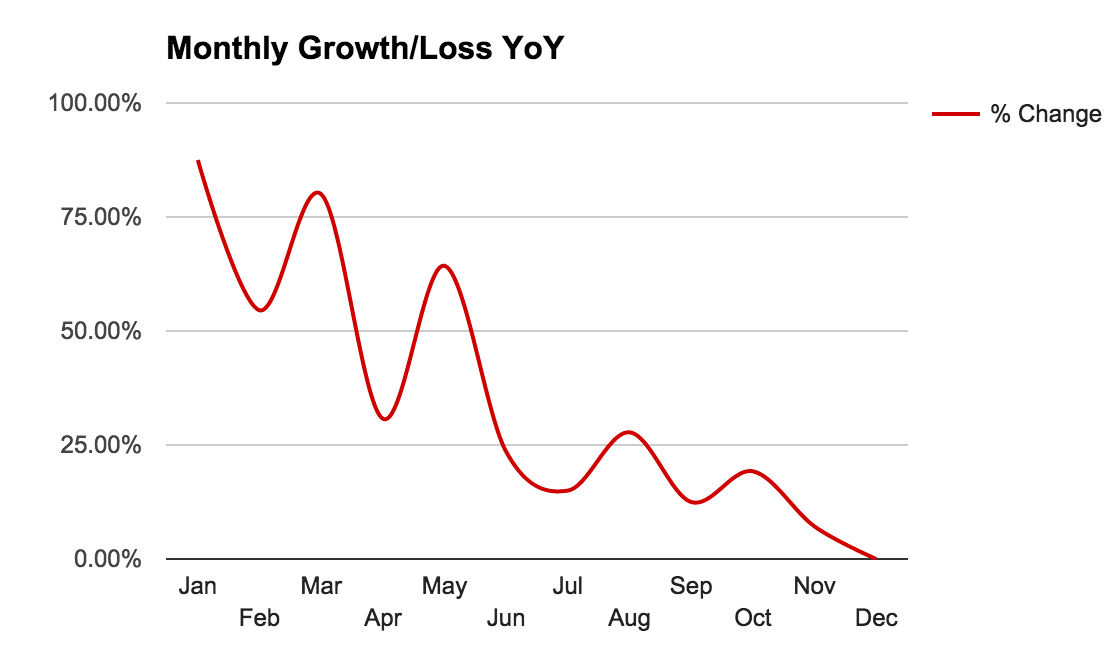
This chart confirms what we suspected from the year-over-year revenue plot: while the business was growing (and growing rather rapidly), in recent months that growth has slowed significantly.
Of course, this doesn’t mean this is a bad business by any means. Slowing revenues can be the result of any number of causes. What this does mean is that you should investigate this more closely.
Drawing Conclusions From Your Analysis
You must be careful in drawing strong conclusions from financial records alone. Financial records help color the story and journey of a business, but they can’t tell that story on their own. Just because a business is trending strongly in one direction is not an indication that it will continue to trend in that way.
You should do financial trend analysis to uncover what makes the business grow, shrink, or remain stable. In other words, a financial trend shows you what happened to the revenues and earnings, but you need to ask and identify why that happened.
In our example above, there could be any number of reasons growth slowed:
- The owner may have pulled back on some marketing efforts, such as PPC, or blogging, or social media posting
- There may be increased competition in the industry
- The initial growth could be the business reaching a comfortable market level, but now that it has hit that level it is stabilizing
- The owner may have experimented with a different website design that reduced conversion rates
- The industry could be changing where the products in question are no longer in demand
- The slowing of growth could be an outside trend that will recover over the next year
As you can see, the possible reasons for the slowing of growth could vary significantly. These multiple reasons is why the data alone is not enough: it doesn’t answer the question of “what happened” and “why is the data doing this”. The only way to explain “what happened” is to ask questions to the owner.
Need Capital for Growth?
Visit Our Partner Page to View a List of Growth Capital Firms We’ve Worked with Over the Years.
Conclusion
There is really no excuse to not do some basic financial analysis on a potential website acquisition. As you can see, the process itself is easy to set up, and using the aid of a spreadsheet like Excel, you can quickly calculate growth and percentages to help interpret the data. This data can also reveal underlying trends that the seller does not know.
I would recommend that every buyer do this type of analysis on any potential acquisition, just be sure to give the numbers their proper context. A negative trend does not mean that the business is necessarily going to fail, just as a positive trend does not mean that the business is going to grow. The numbers are simply the result of a bigger story.
Once you have this story, however, you can make a much better judgment about acquiring a particular website. You won’t have to rely on your gut instincts anymore and can point to quantifiable, hard data.